Portfolio Jensen Hu

Modeling the Occurrence of Stroke - Binary Classification with Python's Scikit Learn

# packages
import pandas as pd
import numpy as np
import matplotlib.pyplot as plt
import seaborn as sns
---------------------------------------------------------------------------

ModuleNotFoundError                       Traceback (most recent call last)

<ipython-input-10-6d7c1745ed9f> in <module>
      4 import matplotlib.pyplot as plt
      5 import seaborn as sns
----> 6 import missingno as msno # missing data


ModuleNotFoundError: No module named 'missingno'

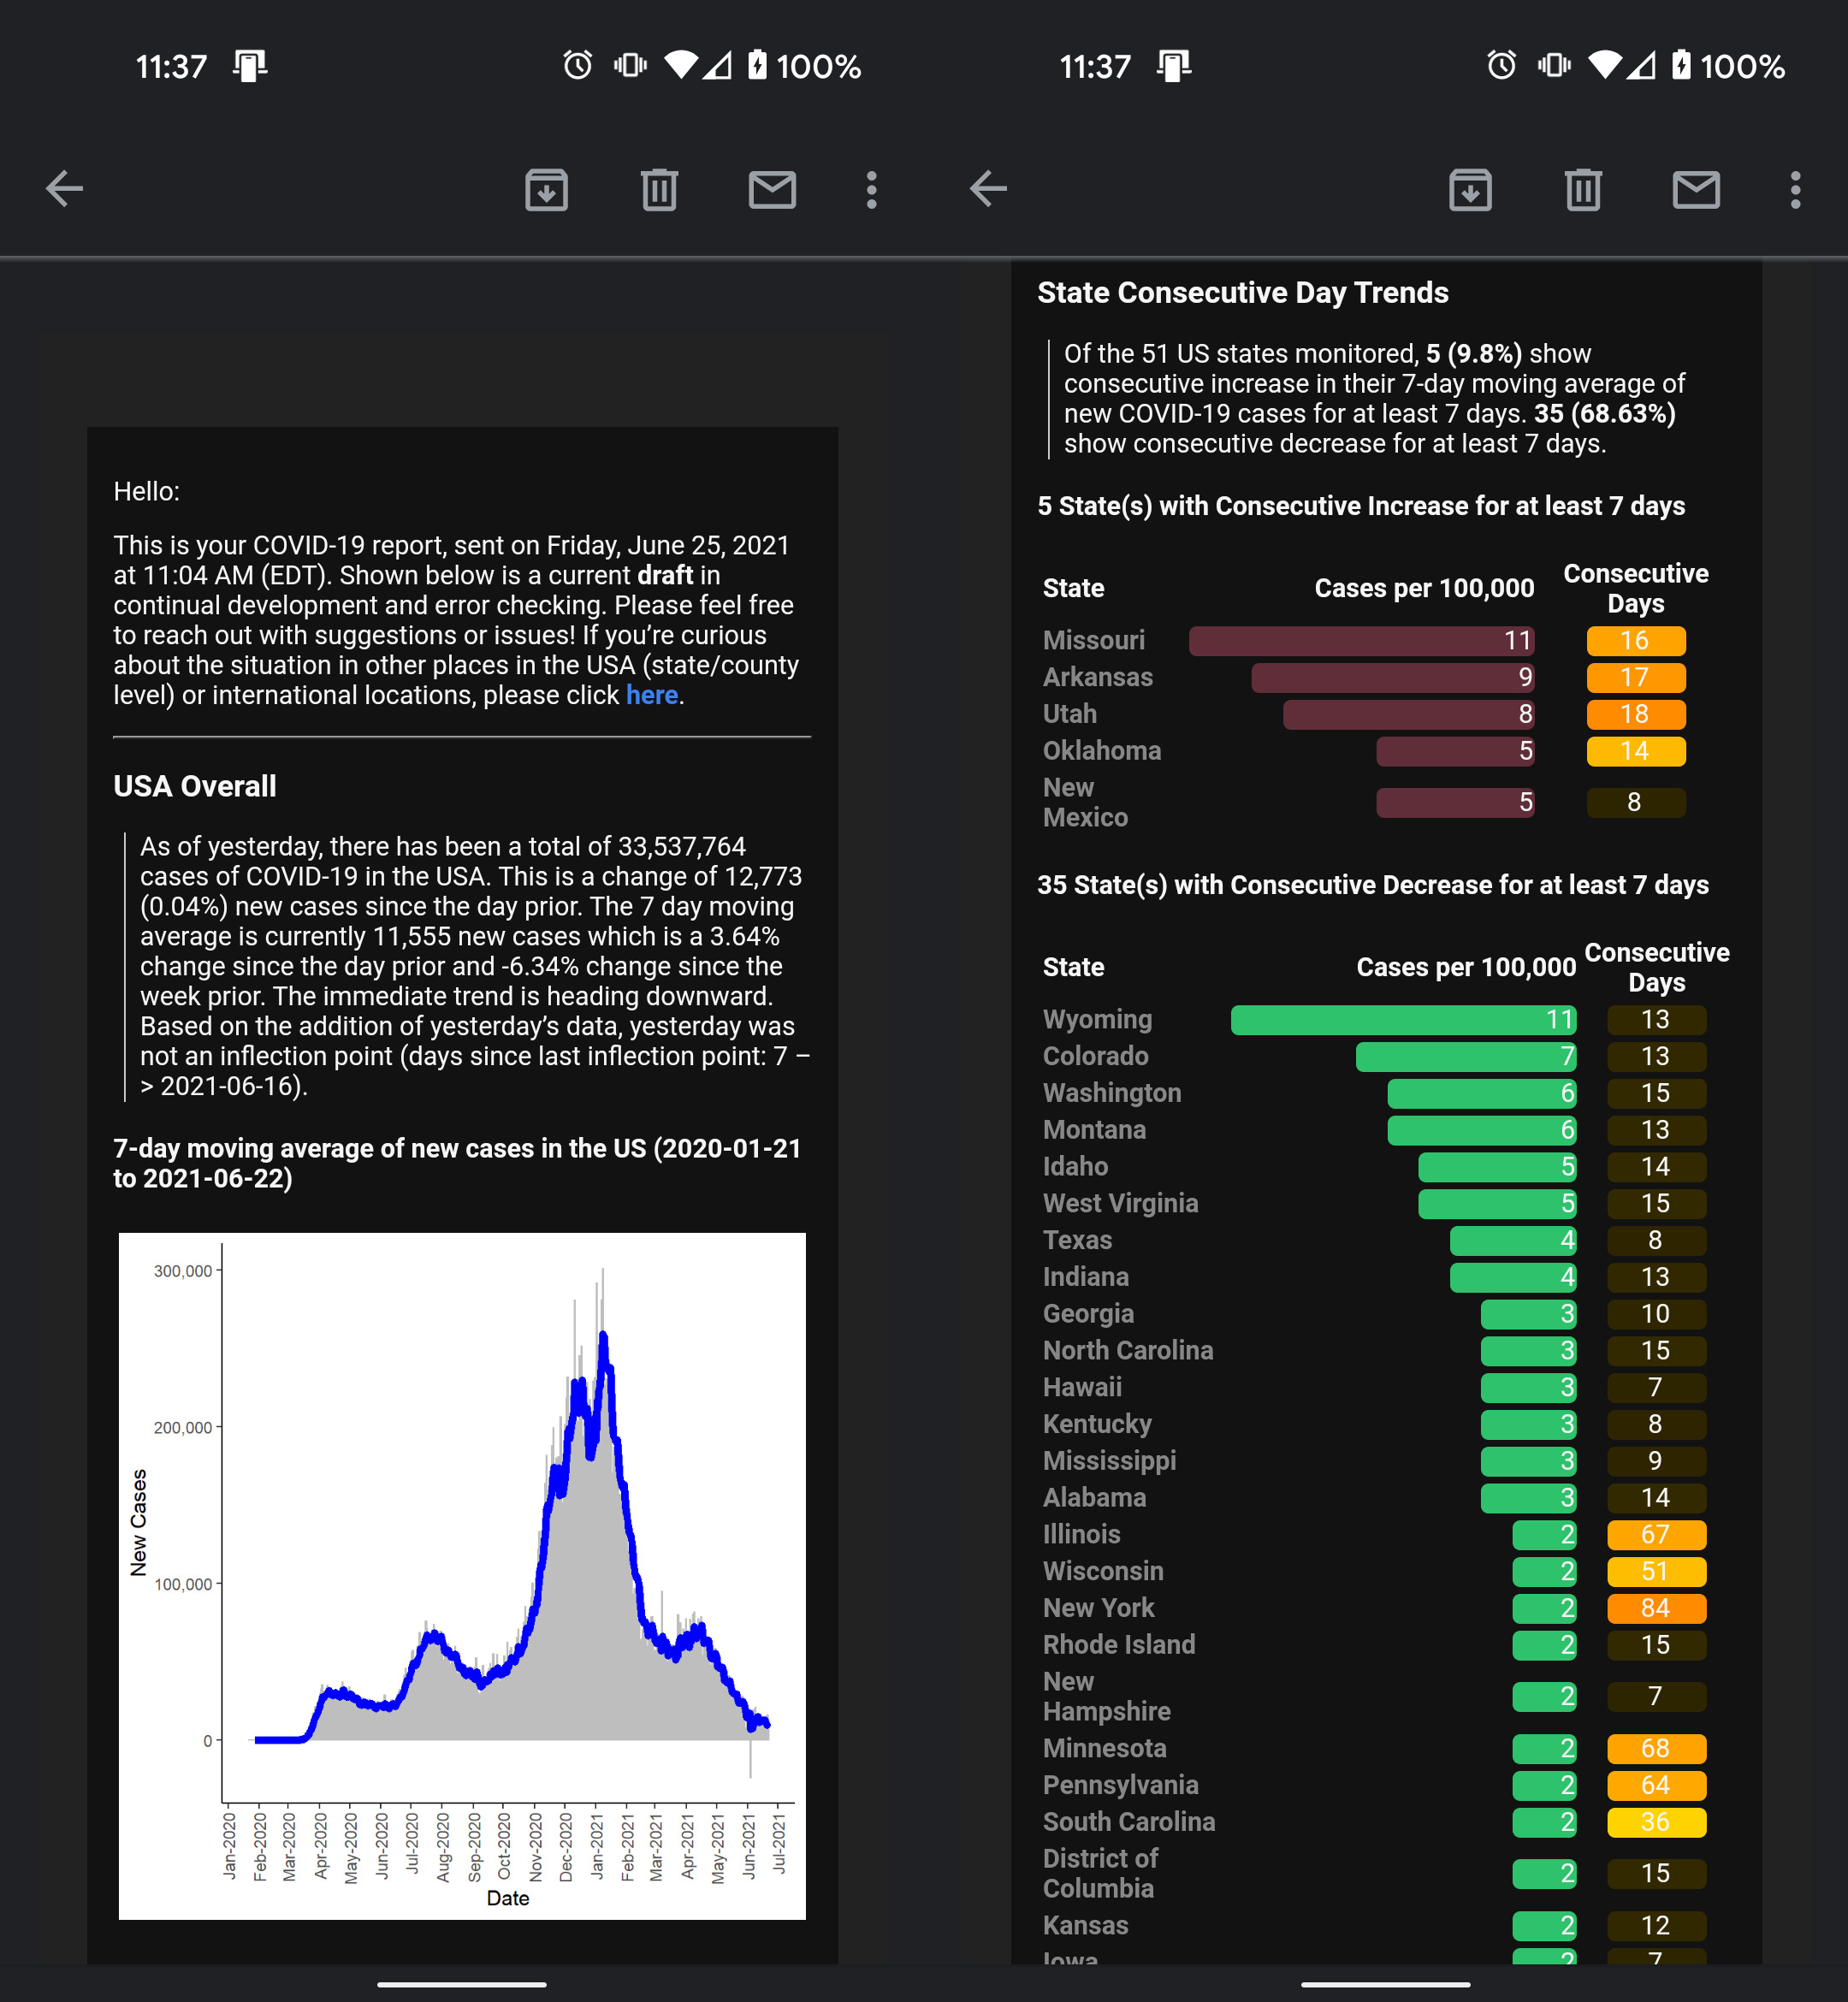
Dataset : Stroke Prediction Data Date: 2/6/2022 Shape: 5110 rows, 12 columns

# read stroke data
stroke = pd.read_csv("healthcare-dataset-stroke-data.csv")
stroke.head()
id gender age hypertension heart_disease ever_married work_type Residence_type avg_glucose_level bmi smoking_status stroke
0 9046 Male 67.0 0 1 Yes Private Urban 228.69 36.6 formerly smoked 1
1 51676 Female 61.0 0 0 Yes Self-employed Rural 202.21 NaN never smoked 1
2 31112 Male 80.0 0 1 Yes Private Rural 105.92 32.5 never smoked 1
3 60182 Female 49.0 0 0 Yes Private Urban 171.23 34.4 smokes 1
4 1665 Female 79.0 1 0 Yes Self-employed Rural 174.12 24.0 never smoked 1
stroke.shape
(5110, 12)
stroke.info()
<class 'pandas.core.frame.DataFrame'>
RangeIndex: 5110 entries, 0 to 5109
Data columns (total 12 columns):
 #   Column             Non-Null Count  Dtype  
---  ------             --------------  -----  
 0   id                 5110 non-null   int64  
 1   gender             5110 non-null   object 
 2   age                5110 non-null   float64
 3   hypertension       5110 non-null   int64  
 4   heart_disease      5110 non-null   int64  
 5   ever_married       5110 non-null   object 
 6   work_type          5110 non-null   object 
 7   Residence_type     5110 non-null   object 
 8   avg_glucose_level  5110 non-null   float64
 9   bmi                4909 non-null   float64
 10  smoking_status     5110 non-null   object 
 11  stroke             5110 non-null   int64  
dtypes: float64(3), int64(4), object(5)
memory usage: 479.2+ KB

Notes:

  • id - shown as numeric, but should probably be binary obj
  • Hypertension and Heart Disease should character vars
  • Work type, Residence, Smoking_status are categorical
  • bmi has missing values, needs to be imputed or removed
#convert variables
stroke['id'] = stroke['id'].astype(str)
stroke.info()
<class 'pandas.core.frame.DataFrame'>
RangeIndex: 5110 entries, 0 to 5109
Data columns (total 12 columns):
 #   Column             Non-Null Count  Dtype  
---  ------             --------------  -----  
 0   id                 5110 non-null   object 
 1   gender             5110 non-null   object 
 2   age                5110 non-null   float64
 3   hypertension       5110 non-null   int64  
 4   heart_disease      5110 non-null   int64  
 5   ever_married       5110 non-null   object 
 6   work_type          5110 non-null   object 
 7   Residence_type     5110 non-null   object 
 8   avg_glucose_level  5110 non-null   float64
 9   bmi                4909 non-null   float64
 10  smoking_status     5110 non-null   object 
 11  stroke             5110 non-null   int64  
dtypes: float64(3), int64(3), object(6)
memory usage: 479.2+ KB
# missing data 
sns.heatmap(stroke.isnull(), cbar=False)
<AxesSubplot:>

png

# review missing data (BMI)
stroke.loc[stroke['bmi'].isna(), 'bmi_missing'] = 1
stroke.loc[-stroke['bmi'].isna(), 'bmi_missing'] = 0

# check to see if missing data is correlated
corr_matrix = stroke.corr()
corr_matrix['bmi_missing'].sort_values(ascending = False)
bmi_missing          1.000000
stroke               0.141238
heart_disease        0.098621
hypertension         0.093046
avg_glucose_level    0.091957
age                  0.078956
bmi                       NaN
Name: bmi_missing, dtype: float64

stroke.hist(figsize = (12, 10))
plt.show()

png

stroke.columns
cat = ['gender', 'hypertension', 'heart_disease', 'ever_married',
       'work_type', 'Residence_type', 'smoking_status']
for c in cat:
    print(stroke[c].value_counts())
# train test split our dataset
from sklearn.model_selection import train_test_split
train_set, test_set = train_test_split(stroke, test_size = 0.2, random_state = 42)
train_set.shape
test_set.shape
# explore data with a copy of the train set 
explore = train_set.copy()
# check out correlations
corr_matrix = explore.corr()
corr_matrix['stroke'].sort_values(ascending = False)
explore['hypertension'] = explore['hypertension'].astype(str)
explore['heart_disease'] = explore['heart_disease'].astype(str)
explore['stroke'] = explore['stroke'].astype(str)
explore.info()

from sklearn.impute import SimpleImputer
imputer = SimpleImputer(strategy = "median")
explore_num = explore[['age', 'avg_glucose_level', 'stroke']]
imputer.fit(explore_num)
imputer.statistics_


Predicting California Housing Price - Regression using Python's Scikit Learn

Automated email reporting during the COVID-19 Pandemic (July 2020 - Present)

Aim: Reduce anxiety, stress, and misinformation during the COVID-19 pandemic by providing consistent reporting in an easily digestible and accessible format. Take in feedback from end-users/consumers, identify areas of improvement.

Introduction
In New York City’s first COVID-19 wave (starting April 2020), I was overwhelmed parsing through new information, news, and data being released about COVID-19. In April, New York Times released their public ongoing repository for COVID-19 data for researchers and officials. Dashboards and visualizations were built and released, but I didn’t find them personable. Instead of a standing resource of high-level information to visit, I was looking for reliable data points on the outbreak to be delivered to me, daily. This is where automated email reporting came into play!

Methods
There were three main R scripts to:

  • (1) Load and transform COVID-19 data from NYTimes and JHU.
  • (2) Compile tables and plots into report layout using RMarkdown
  • (3) Email compiled report to recipients using Blastula package

This email report was sent to ~20+ people interested in receiving daily updates on COVID-19. Recipients were able to provide ongoing feedback to improve the report’s interpretability and content. Edits were made to the main scripts in a staging folder separate from a production folder. I automated the report distribution using my computer’s windows task scheduler which triggered a .bat file and subsequently the “send_email.R” script. Sending an email from R required an email account/provider that allowed third-party access.

Lessons Learned
Here are some of the major lessons learned from this project:

  • Delays and issues in uploading information to data sources happen. Set flags within scripts to terminate code when necessary.
  • In order to successfully automate a script, consider a cloud-based solution. My local desktop computer’s window task scheduler depends on AC power and wifi/internet connection (the latter for pulling data from github and sending emails). If either of those pieces were missing, the report did not go out.
  • Blastula and mailR packages are great options for email distribution via R. I ended up going with Blastula because it was able to render an rmarkdown file which was easier to customize.

Data Sources:
https://github.com/nytimes/covid-19-data
https://github.com/CSSEGISandData/COVID-19

Tools: blastula, dplyr, ggplot2

mh_needs_svi_dash2 mh_needs_svi_dash2

Also, visit the project on GitHub.

Disclaimer: the opinions expressed and analyses performed are solely my own and do not necessarily reflect the official policy or position of my employer.

Exploring NYC's social vulnerability and child opportunity with the intent of assessing child mental health need in the context of COVID-19 and racial injustice

Alternative title: Assessment of NYC’s Child Mental Health Need using the CDC’s Social Vulnerability Index (SVI) and the Child Opportunity Index (COI) in the context of COVID19 and Racial Injustice

mh_needs_svi_dash2

Aim: routing public health efforts and mental health resources to areas of high risk and need.

  • Why focus on the mental health needs of children?

Traumatic events have long term impact on the social and economic fabric within our communities and influence the perception, development, and health outcomes of the youngest among us. The effects of COVID-19 and incidences of racial injustice are significant trauma in the lives of children today.

COVID-19 disproportionately uprooted (and continues to do so) lives of those in minority communities. From lives lost as a result of COVID-19 infection to financial instability due to economic shut down to major disruptions in learning and education, the coronavirus pandemic has revealed society’s racial inequity and our population’s most vulnerable and in greatest need of support.

The murder of George Floyd in Minneapolis, Ahmaud Arbery in Georgia, and Breonna Taylor in Louisville, although geographically separate, share the same vein of systemic racism as COVID-19 within our country. As Commissioner Barbot put “trauma within the trauma of the COVID-19 public health emergency.” Chronic grief, fear, and instability put children within our minority communities at great risk.

As the future of our communities, children - especially those with existing socioeconomic disadvantages - need mental health resources and support to navigate the long term effects of these traumatic events.

  • Why use the Social Vulnerability Index (SVI)?

    SVI data can be used to identify communities that will need continued support to recover following an emergency or natural disaster, and allocate emergency preparedness funding by community need. - CDC

  • Why use the Child Opportunity Index (COI)?

    Neighborhoods matter for children’s health and development… There is wide variation in child opportunity across metros but wider inequities occur within metros. Although metros are relatively small geographic areas, the opportunity gap for children is often as wide (or wider) within metros as it is across metros throughout the country. Within a given metro area, children who live only short distances apart often experience two completely different worlds of neighborhood opportunity. - diversitydatakids.org

Find out more by exploring my dashboard (best opened on desktop)
Also, visit the project on GitHub.

Disclaimer: the opinions expressed and analyses performed are solely my own and do not necessarily reflect the official policy or position of my employer.