28 Mar 2026
Aim:
(1) Learn about computer vision in volleyball.
(2) Use AI to create an end-to-end platform to assist with training a computer vision model to detect spikes and classify phases.
(3) Leveraging the trained model, use AI to create a mobile app to save users spike videos and record bio-mechanic metrics.
Introduction:
Volleyball is one of my favorite activities. Over the past few years, I’ve gotten more invested into improving my technique and game play. Watching youtube videos on how to pass better, professional player highlights in slow-mo, participating in tournaments, attending clinics… the grind to get better is lifelong journey.
One skill I’ve gotten better at is hitting (spiking). Although it can be simplified to just “jumping and smacking the ball” there’s a breadth of nuance and serious biomechanics behind it. From the approach and intentional shift in momentum, to torque derived from the connection of the hip and shoulder separation, there is ton to analyze. I often record my own hits to pick at specific details. Constant pausing and unpausing to segment and decipher body positioning in relation to the ball, reviewing what I could do better next time. As someone looking for ways to improve, I thought computer vision and volleyball was a natural choice.
DRAFT IN PROGRESS:
Current Research:
Fast ball tracking
Court vision and boundary segmentation
Skeletal data
Person tracking
Action-based categorization using LSTM
Initial Pipeline:
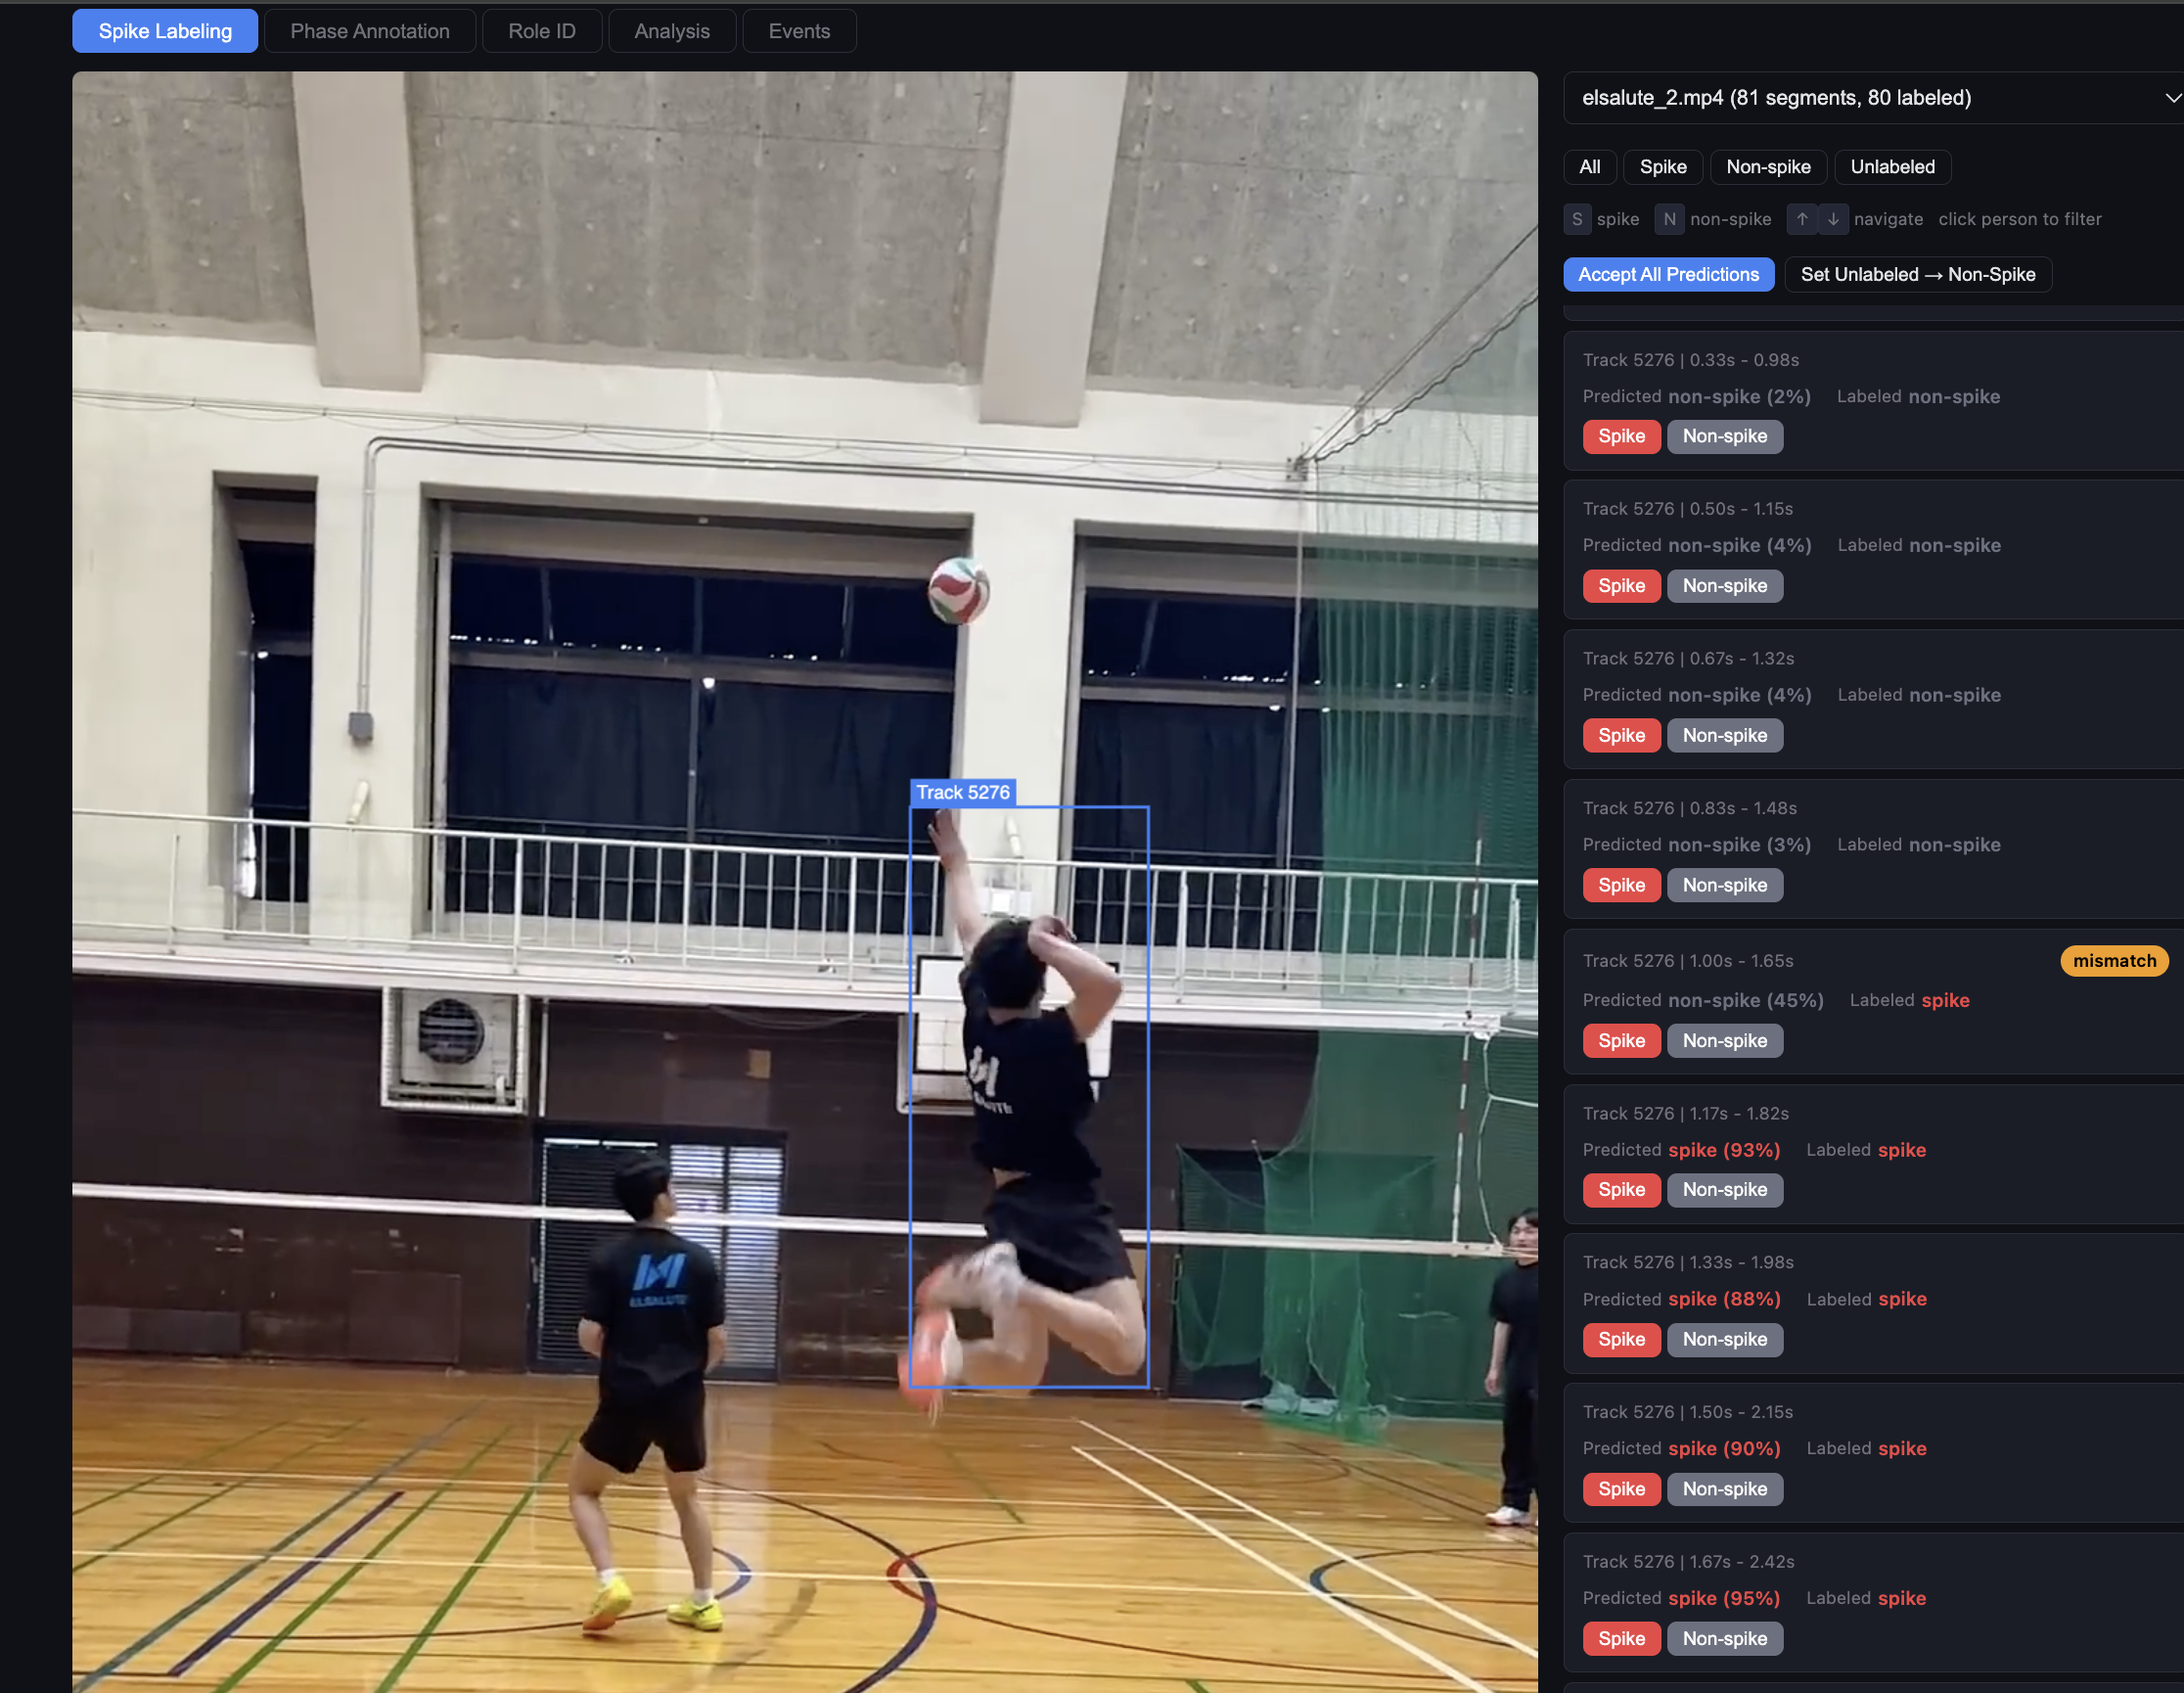
Harvest youtube videos -> import into CVAT and annotate -> export as COCO format -> run python script to map skeletal data to annotated frames -> run python script to stack data and train/test split -> evaluate model
Desired uses:
Detecting people and the ball.
Detecting hits (spikes).
Classification of a spike sequence.
Biomechanic metrics.
Lessons Learned:
- Think about project processes and use AI to create your own SAAS to improve project efficiency and scalability early on. This sounds like overkill, but making progress on a long term project can be tough and often requires regrouping, reorganizing, re-everything. Your process may be straightforward on day one, but each new script or project branch or third party tool can increase process complexity and stretch your attention and resources (especially if outside SAAS aren’t free). For example, when training the LSTM model, I initially uploaded a video to CVAT (platform for annotating videos), label the sequences, output and archive my annotations, import them into a python script to map those annotations to skeletal data based on their frame reference numbers, stack on existing data, run another python script to train/test split, evaluate the model. Doing this one or two times is fine, but knowing I might need to do this hundreds of times, became a growing concern. So I prompted claude to create an end-to-end platform that would integrate the capabilities of CVAT and my python scripts, designed specifically to import, collect, label, amass a dataset of videos, and track the training/evaluation of my models.
Disclaimer: the opinions expressed and analyses performed are solely my own and do not necessarily reflect the official policy or position of my employer.
28 Mar 2026
Aim:
(1) Learn about computer vision in volleyball.
(2) Use AI to create an end-to-end platform to assist with training a computer vision model to detect spikes and classify phases.
(3) Leveraging the trained model, use AI to create a mobile app to save users spike videos and record bio-mechanic metrics.
Introduction:
Volleyball is one of my favorite activities. Over the past few years, I’ve gotten more invested into improving my technique and game play. Watching youtube videos on how to pass better, professional player highlights in slow-mo, participating in tournaments, attending clinics… the grind to get better is lifelong journey.
One skill I’ve gotten better at is hitting (spiking). Although it can be simplified to just “jumping and smacking the ball” there’s a breadth of nuance and serious biomechanics behind it. From the approach and intentional shift in momentum, to torque derived from the connection of the hip and shoulder separation, there is ton to analyze. I often record my own hits to pick at specific details. Constant pausing and unpausing to segment and decipher body positioning in relation to the ball, reviewing what I could do better next time. As someone looking for ways to improve, I thought computer vision and volleyball was a natural choice.
DRAFT IN PROGRESS:
Current Research:
Fast ball tracking
Court vision and boundary segmentation
Skeletal data
Person tracking
Action-based categorization using LSTM
Initial Pipeline:
Harvest youtube videos -> import into CVAT and annotate -> export as COCO format -> run python script to map skeletal data to annotated frames -> run python script to stack data and train/test split -> evaluate model
Desired uses:
Detecting people and the ball.
Detecting hits (spikes).
Classification of a spike sequence.
Biomechanic metrics.
Lessons Learned:
- Think about project processes and use AI to create your own SAAS to improve project efficiency and scalability early on. This sounds like overkill, but making progress on a long term project can be tough and often requires regrouping, reorganizing, re-everything. Your process may be straightforward on day one, but each new script or project branch or third party tool can increase process complexity and stretch your attention and resources (especially if outside SAAS aren’t free). For example, when training the LSTM model, I initially uploaded a video to CVAT (platform for annotating videos), label the sequences, output and archive my annotations, import them into a python script to map those annotations to skeletal data based on their frame reference numbers, stack on existing data, run another python script to train/test split, evaluate the model. Doing this one or two times is fine, but knowing I might need to do this hundreds of times, became a growing concern. So I prompted claude to create an end-to-end platform that would integrate the capabilities of CVAT and my python scripts, designed specifically to import, collect, label, amass a dataset of videos, and track the training/evaluation of my models.
Disclaimer: the opinions expressed and analyses performed are solely my own and do not necessarily reflect the official policy or position of my employer.
26 Mar 2026
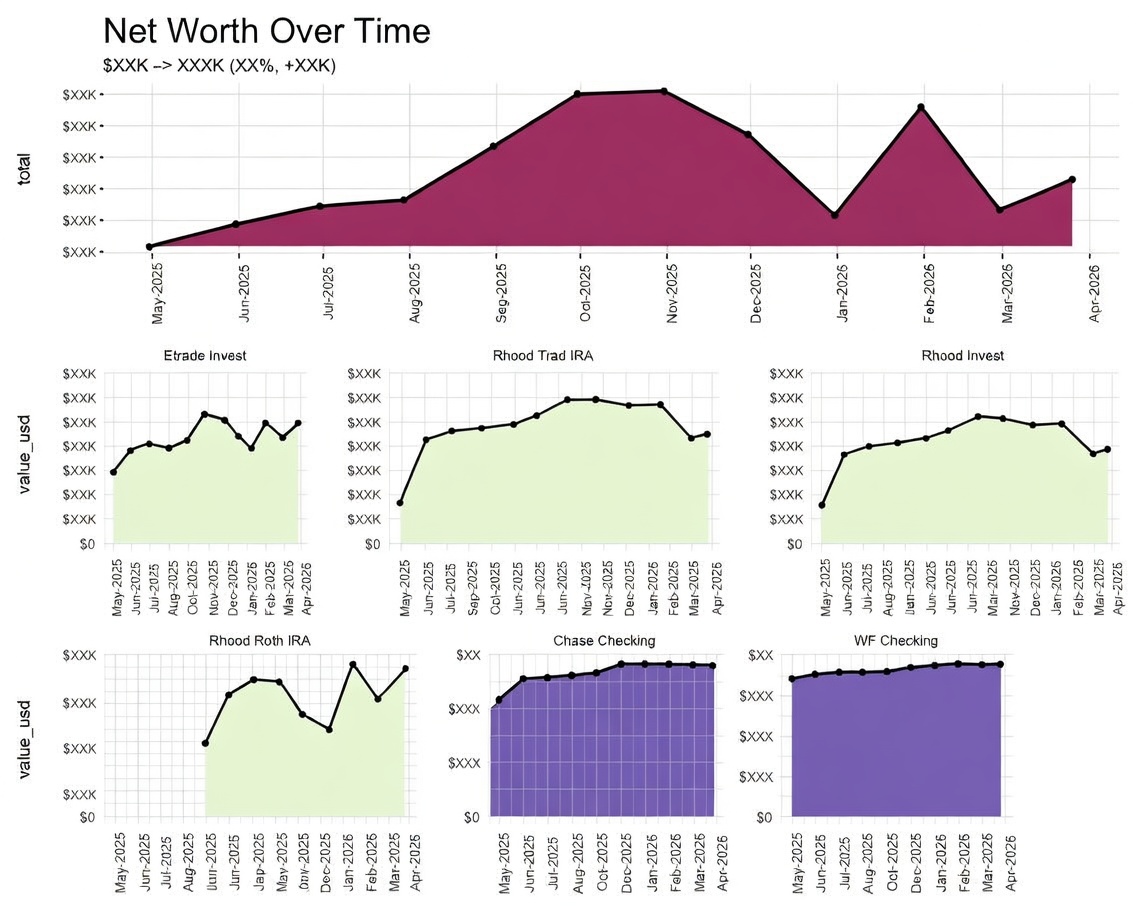
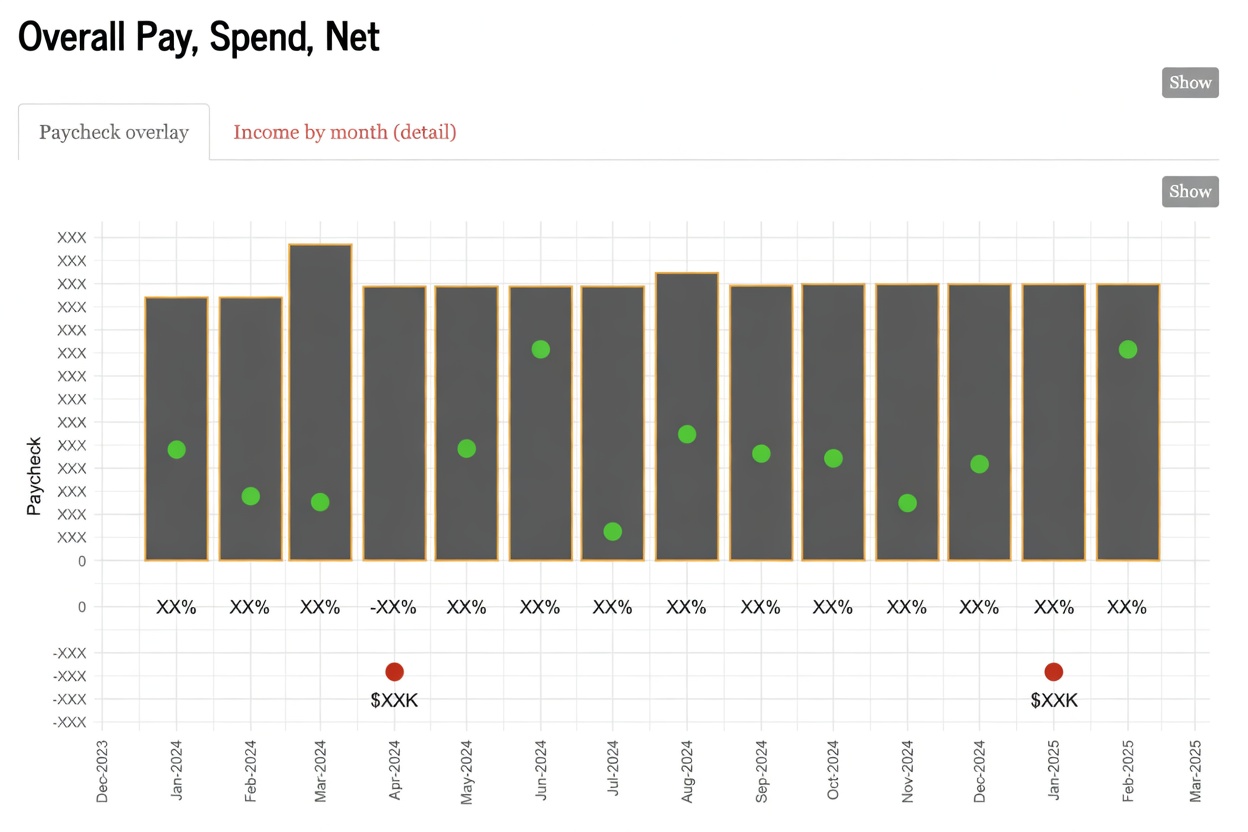
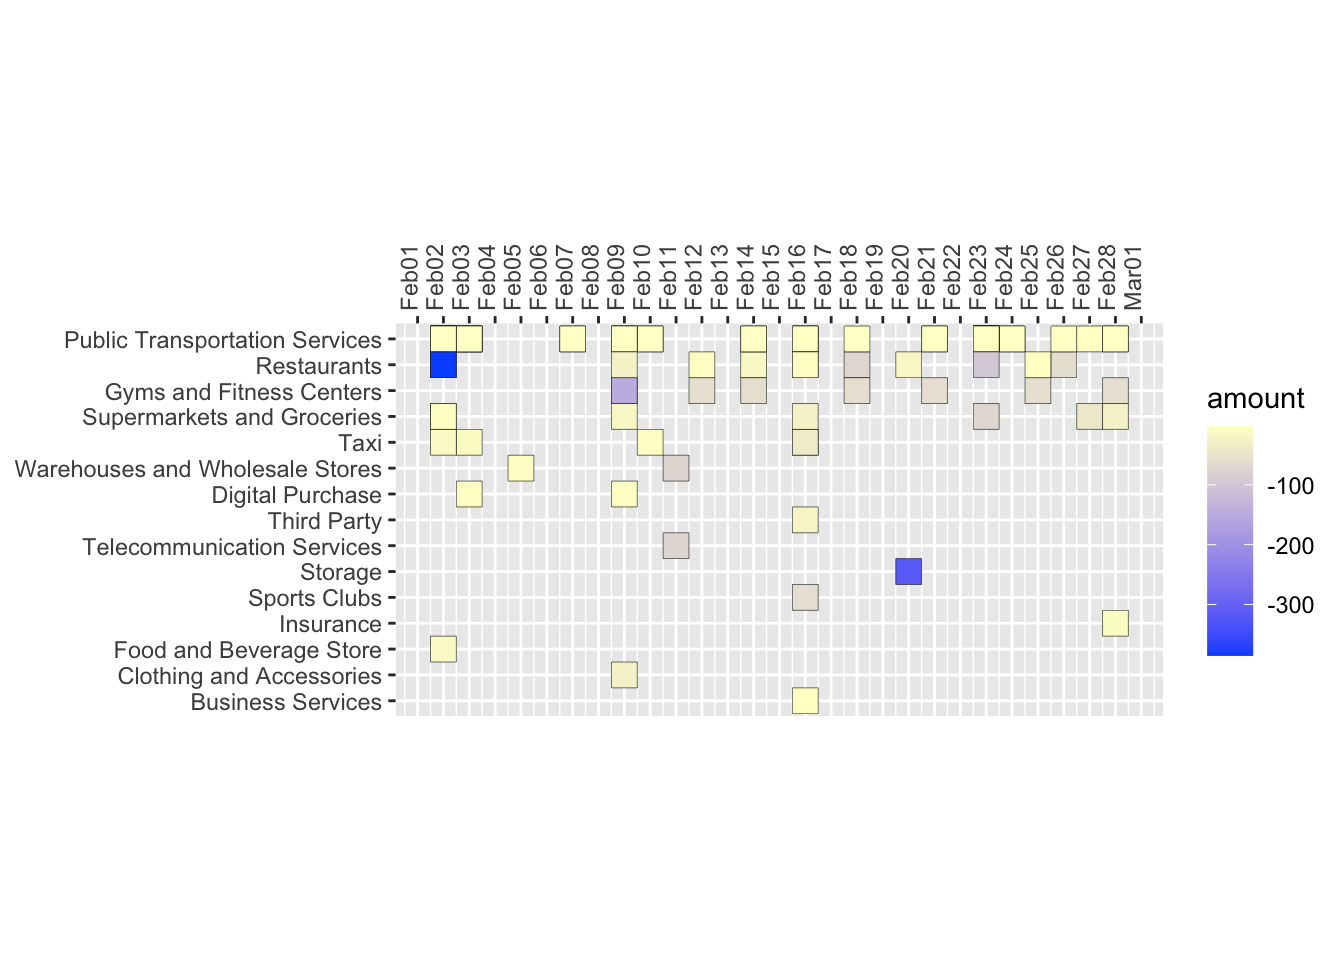
Aim: Improve awareness of expenses and flow of money.
Introduction:
Knowing where your money goes is important. Did I spend beyond my budget on groceries this month? Am I spending more than 50% of my income on rent? Is lifestyle creep affecting my savings? When will I pay off my loans at my current savings rate? The only way to confidently answer these questions is by tracking your finances. Several years ago I used a free app called Mint that let you link your bank accounts and credit cards, etc. , it provided analytics, trends, and allowed me to refresh my balance and see all my transactions in one area. I loved using Mint, but alas, all good things come to an end and Mint shutdown. With that, I decided to build my own financial tracking tool.
Methods:
Google Sheets (Plaid bank feeds) → contains underlying google app script
        │
        ▼
01a_data_prep_live.R        ← cleans balances, transactions, budget
        │
        ▼
  .RDS intermediates
        │
        ├──▶ 02a_data_analytics.Rmd   → Main finance dashboard (HTML)
        └──▶ 03a_md_accounts.Rmd      → Daily email snapshot (Markdown)

GitHub Actions runs the full pipeline daily at 7 AM UTC,
commits outputs, and emails the account summary.
Cloudflare pages hosts html output produced from 02a_data_analytics.Rmd
| Layer |
Tools |
| Data source |
Personal bank account, transaction data |
| Data ingestion |
Plaid → Google Sheets (https://github.com/williamlmao/plaid-to-gsheets), googlesheets4, googledrive |
| Data processing |
dplyr, tidyr, lubridate, janitor |
| Visualization |
ggplot2, patchwork |
| Reporting |
rmarkdown, DT, formattable, fontawesome |
| Automation |
GitHub Actions (daily cron) |
| Hosting |
Cloudflare Pages |
Lessons Learned:
- This was my first time working with a 3-legged auth api. The process of gathering and storing access_tokens for each of my accounts could probably be improved by integrating an auth page into my application frontend instead of manual one-off auth and copy-pasting access_tokens into my google app script.
- The Google app script + google sheet as the backend works fine. A later improvement for better security and flow can be migrating this to a sql database.
- Plaid’s categorization of expenses isn’t perfect so mapping categories to correct labels requires continued iteration. The current case_when code structure to clean expense categories (shown below) is unwieldy and lacks as a robust long term solution. Listing these categories/rules into a separate googlesheet tab or local csv to serve as a look-up may be a more transparent and easily editable solution.
main_category = case_when(plaid_category_1 == "Shops" & plaid_category_2 == "Supermarkets and Groceries" ~ "Groceries" ...)
Sample Pictures:
Check out the github project here
Disclaimer: the opinions expressed and analyses performed are solely my own and do not necessarily reflect the official policy or position of my employer.
14 Sep 2020
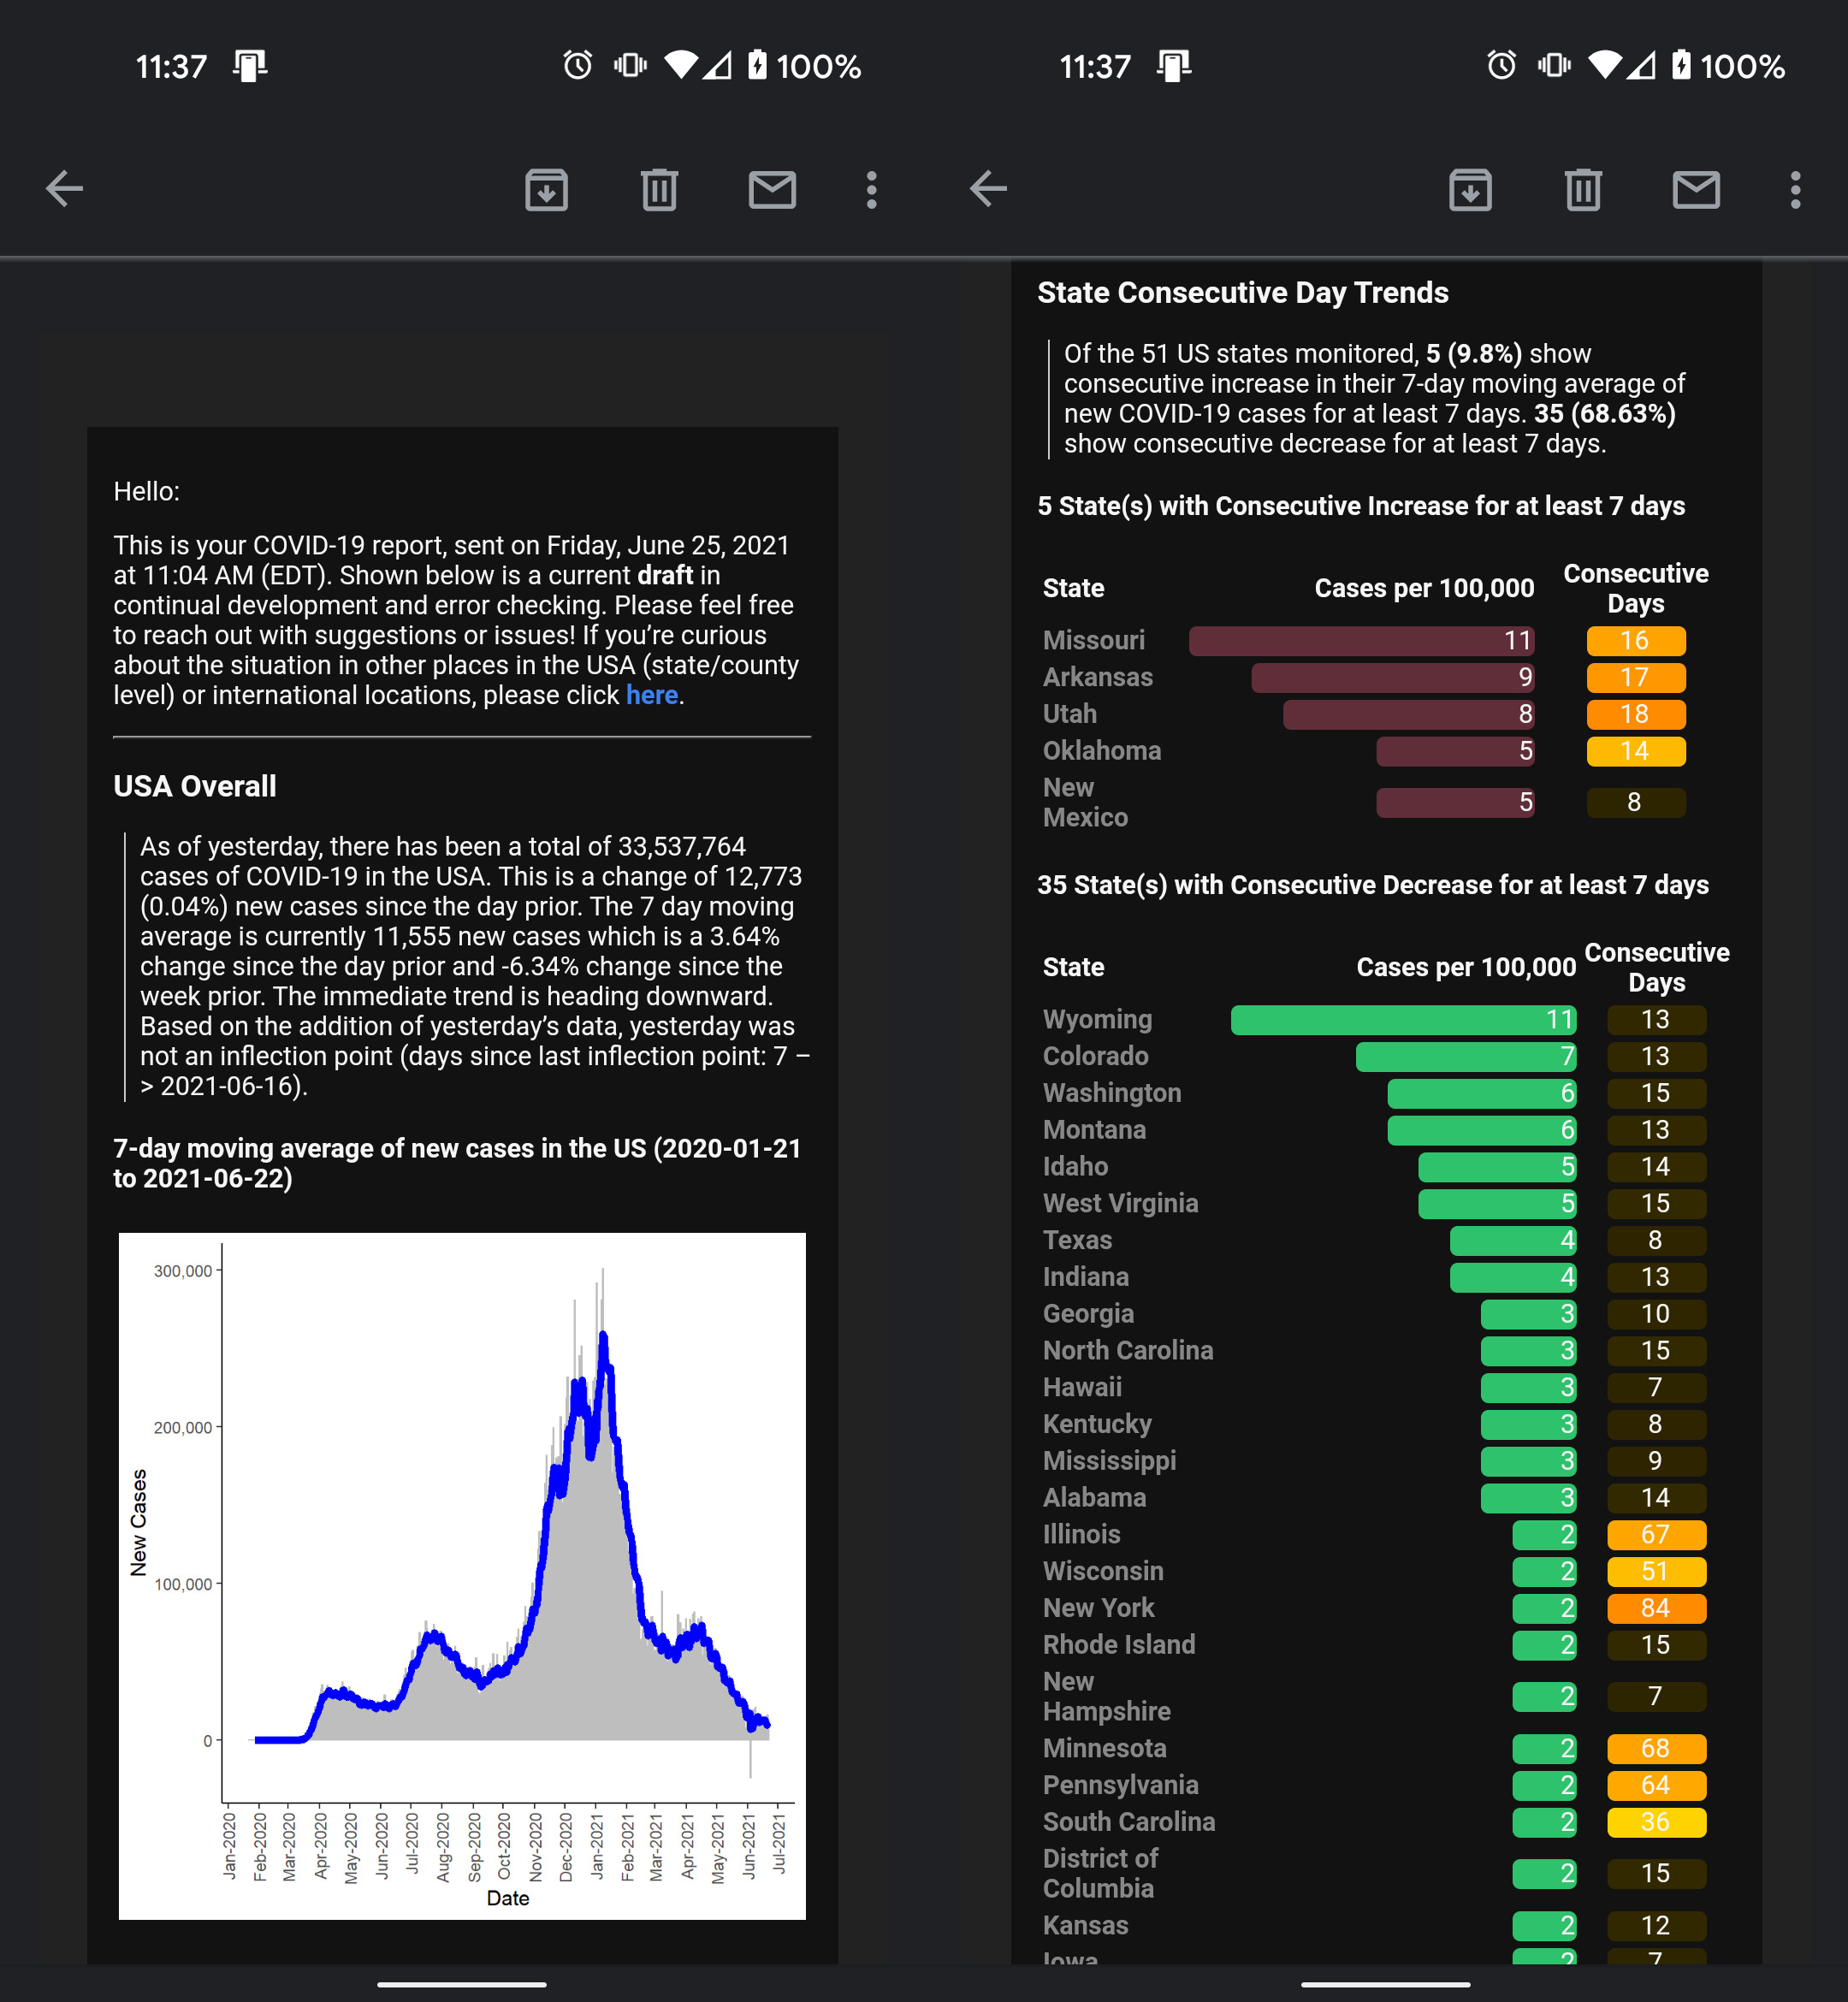
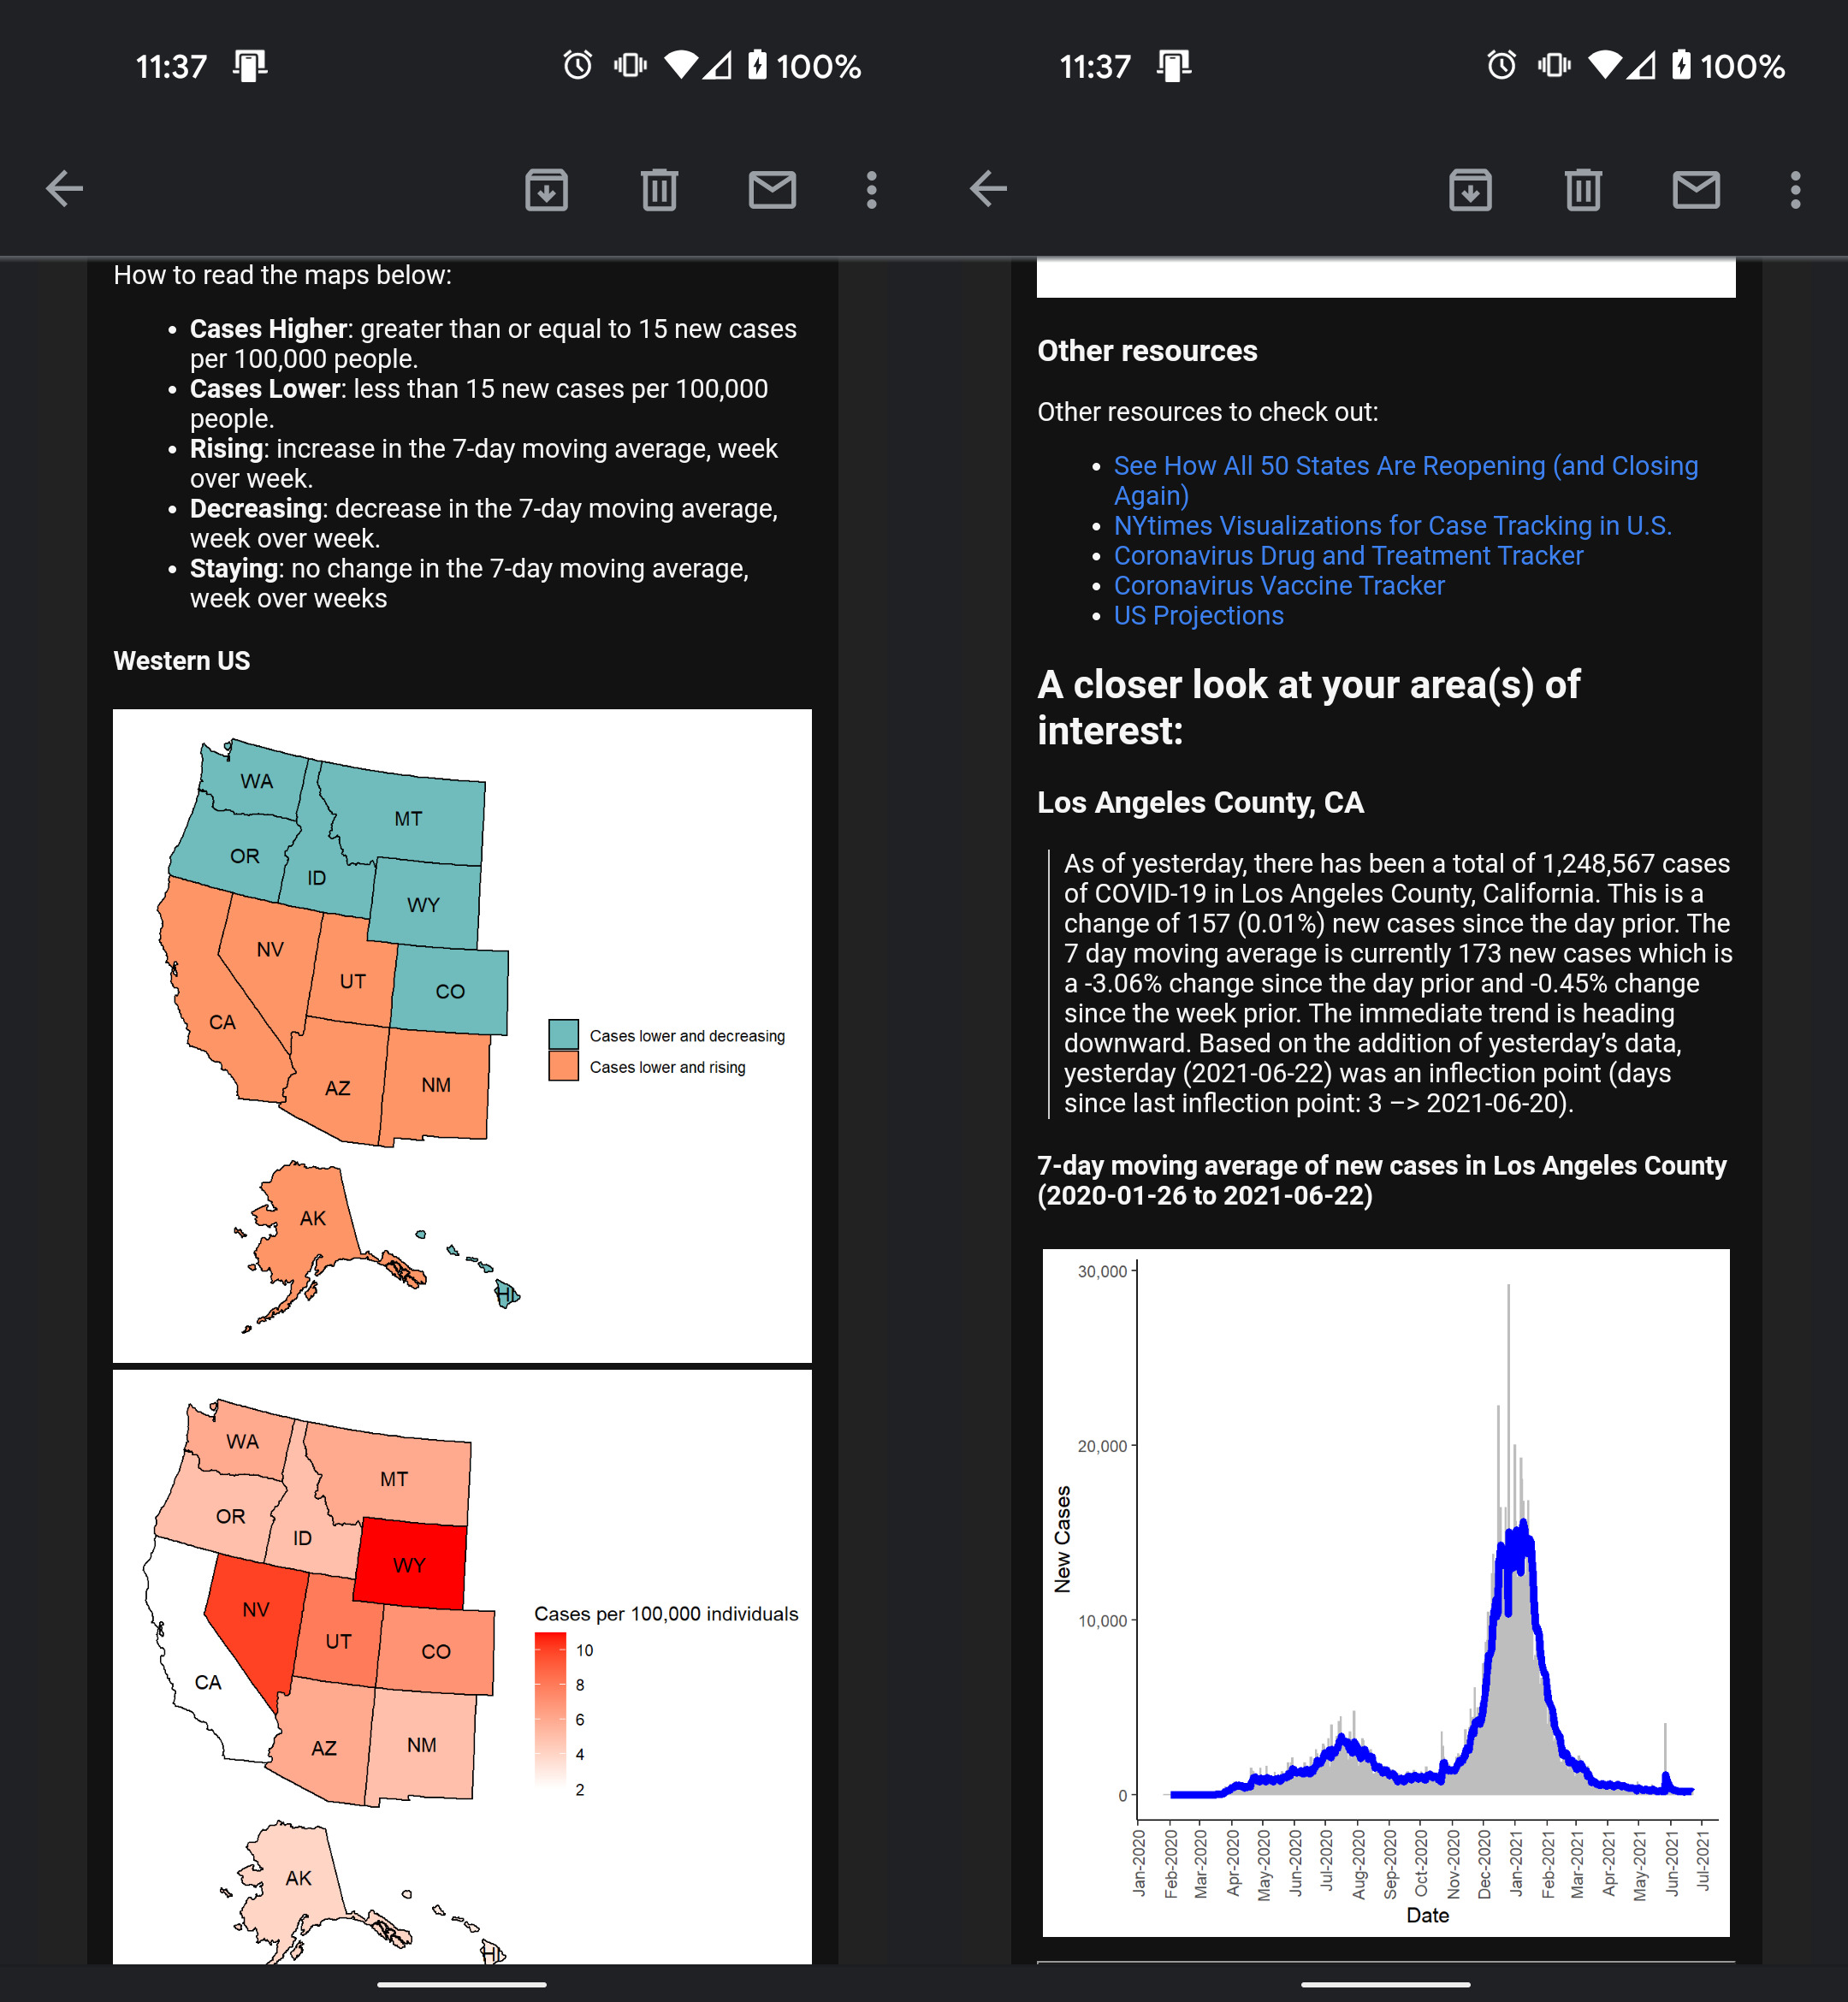
Aim: Reduce anxiety, stress, and misinformation during the COVID-19 pandemic by providing consistent reporting in an easily digestible and accessible format. Take in feedback from end-users/consumers, identify areas of improvement.
Introduction
In New York City’s first COVID-19 wave (starting April 2020), I was overwhelmed parsing through new information, news, and data being released about COVID-19. In April, New York Times released their public ongoing repository for COVID-19 data for researchers and officials. Dashboards and visualizations were built and released, but I didn’t find them personable. Instead of a standing resource of high-level information to visit, I was looking for reliable data points on the outbreak to be delivered to me, daily. This is where automated email reporting came into play!
Methods
There were three main R scripts to:
- (1) Load and transform COVID-19 data from NYTimes and JHU.
- (2) Compile tables and plots into report layout using RMarkdown
- (3) Email compiled report to recipients using Blastula package
This email report was sent to ~20+ people interested in receiving daily updates on COVID-19. Recipients were able to provide ongoing feedback to improve the report’s interpretability and content. Edits were made to the main scripts in a staging folder separate from a production folder. I automated the report distribution using my computer’s windows task scheduler which triggered a .bat file and subsequently the “send_email.R” script. Sending an email from R required an email account/provider that allowed third-party access.
Lessons Learned
Here are some of the major lessons learned from this project:
- Delays and issues in uploading information to data sources happen. Set flags within scripts to terminate code when necessary.
- In order to successfully automate a script, consider a cloud-based solution. My local desktop computer’s window task scheduler depends on AC power and wifi/internet connection (the latter for pulling data from github and sending emails). If either of those pieces were missing, the report did not go out.
- Blastula and mailR packages are great options for email distribution via R. I ended up going with Blastula because it was able to render an rmarkdown file which was easier to customize.
Data Sources:
https://github.com/nytimes/covid-19-data
https://github.com/CSSEGISandData/COVID-19
Tools: blastula, dplyr, ggplot2
Also, visit the project on GitHub.
Disclaimer: the opinions expressed and analyses performed are solely my own and do not necessarily reflect the official policy or position of my employer.
29 May 2020
Alternative title: Assessment of NYC’s Child Mental Health Need using the CDC’s Social Vulnerability Index (SVI) and the Child Opportunity Index (COI) in the context of COVID19 and Racial Injustice
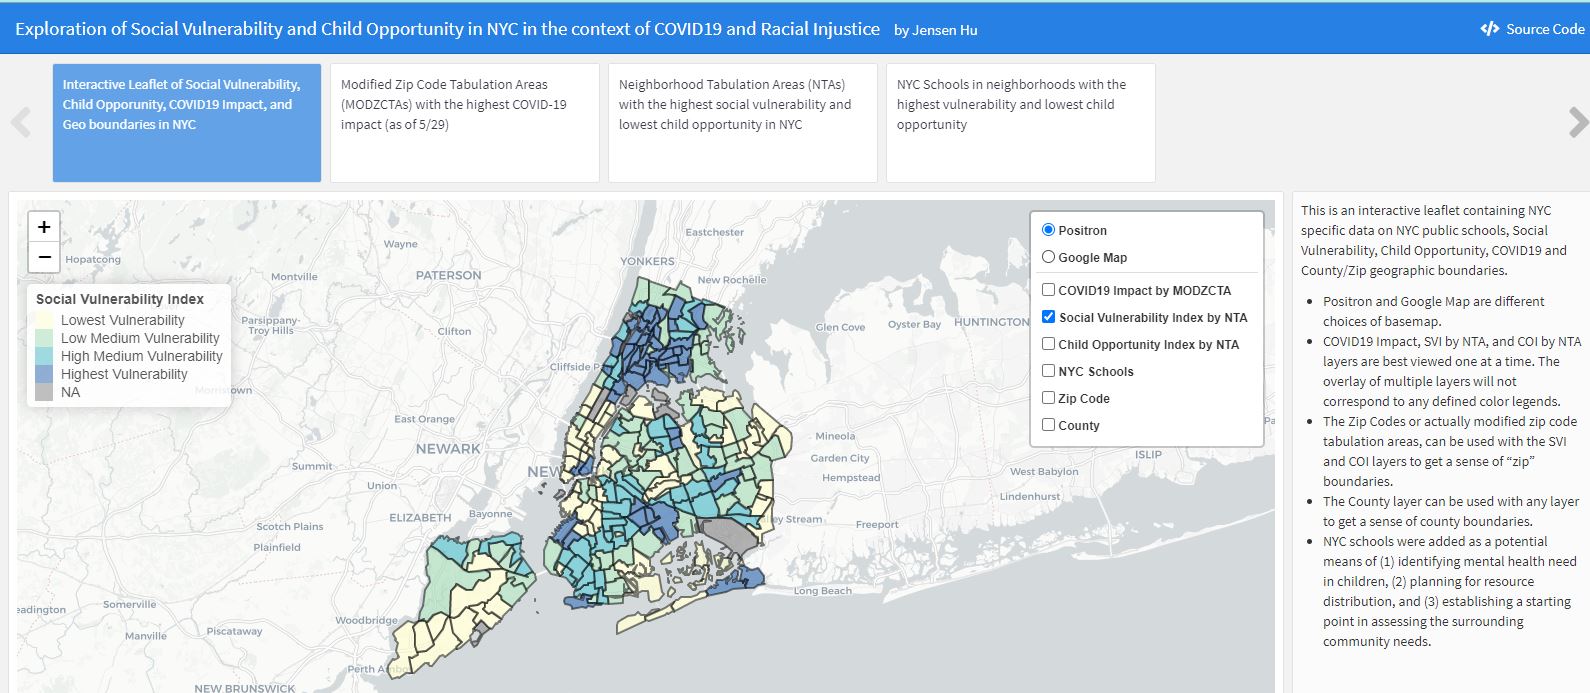
Aim: routing public health efforts and mental health resources to areas of high risk and need.
- Why focus on the mental health needs of children?
Traumatic events have long term impact on the social and economic fabric within our communities and influence the perception, development, and health outcomes of the youngest among us. The effects of COVID-19 and incidences of racial injustice are significant trauma in the lives of children today.
COVID-19 disproportionately uprooted (and continues to do so) lives of those in minority communities. From lives lost as a result of COVID-19 infection to financial instability due to economic shut down to major disruptions in learning and education, the coronavirus pandemic has revealed society’s racial inequity and our population’s most vulnerable and in greatest need of support.
The murder of George Floyd in Minneapolis, Ahmaud Arbery in Georgia, and Breonna Taylor in Louisville, although geographically separate, share the same vein of systemic racism as COVID-19 within our country. As Commissioner Barbot put “trauma within the trauma of the COVID-19 public health emergency.” Chronic grief, fear, and instability put children within our minority communities at great risk.
As the future of our communities, children - especially those with existing socioeconomic disadvantages - need mental health resources and support to navigate the long term effects of these traumatic events.
Find out more by exploring my dashboard (best opened on desktop)
Also, visit the project on GitHub.
Disclaimer: the opinions expressed and analyses performed are solely my own and do not necessarily reflect the official policy or position of my employer.