3 Automated Email Reporting During the COVID-19 Pandemic (July 2020 - Present)
Aim: Reduce anxiety, stress, and misinformation during the COVID-19 pandemic by providing consistent reporting in an easily digestible and accessible format. Take in feedback from end-users/consumers, identify areas of improvement.
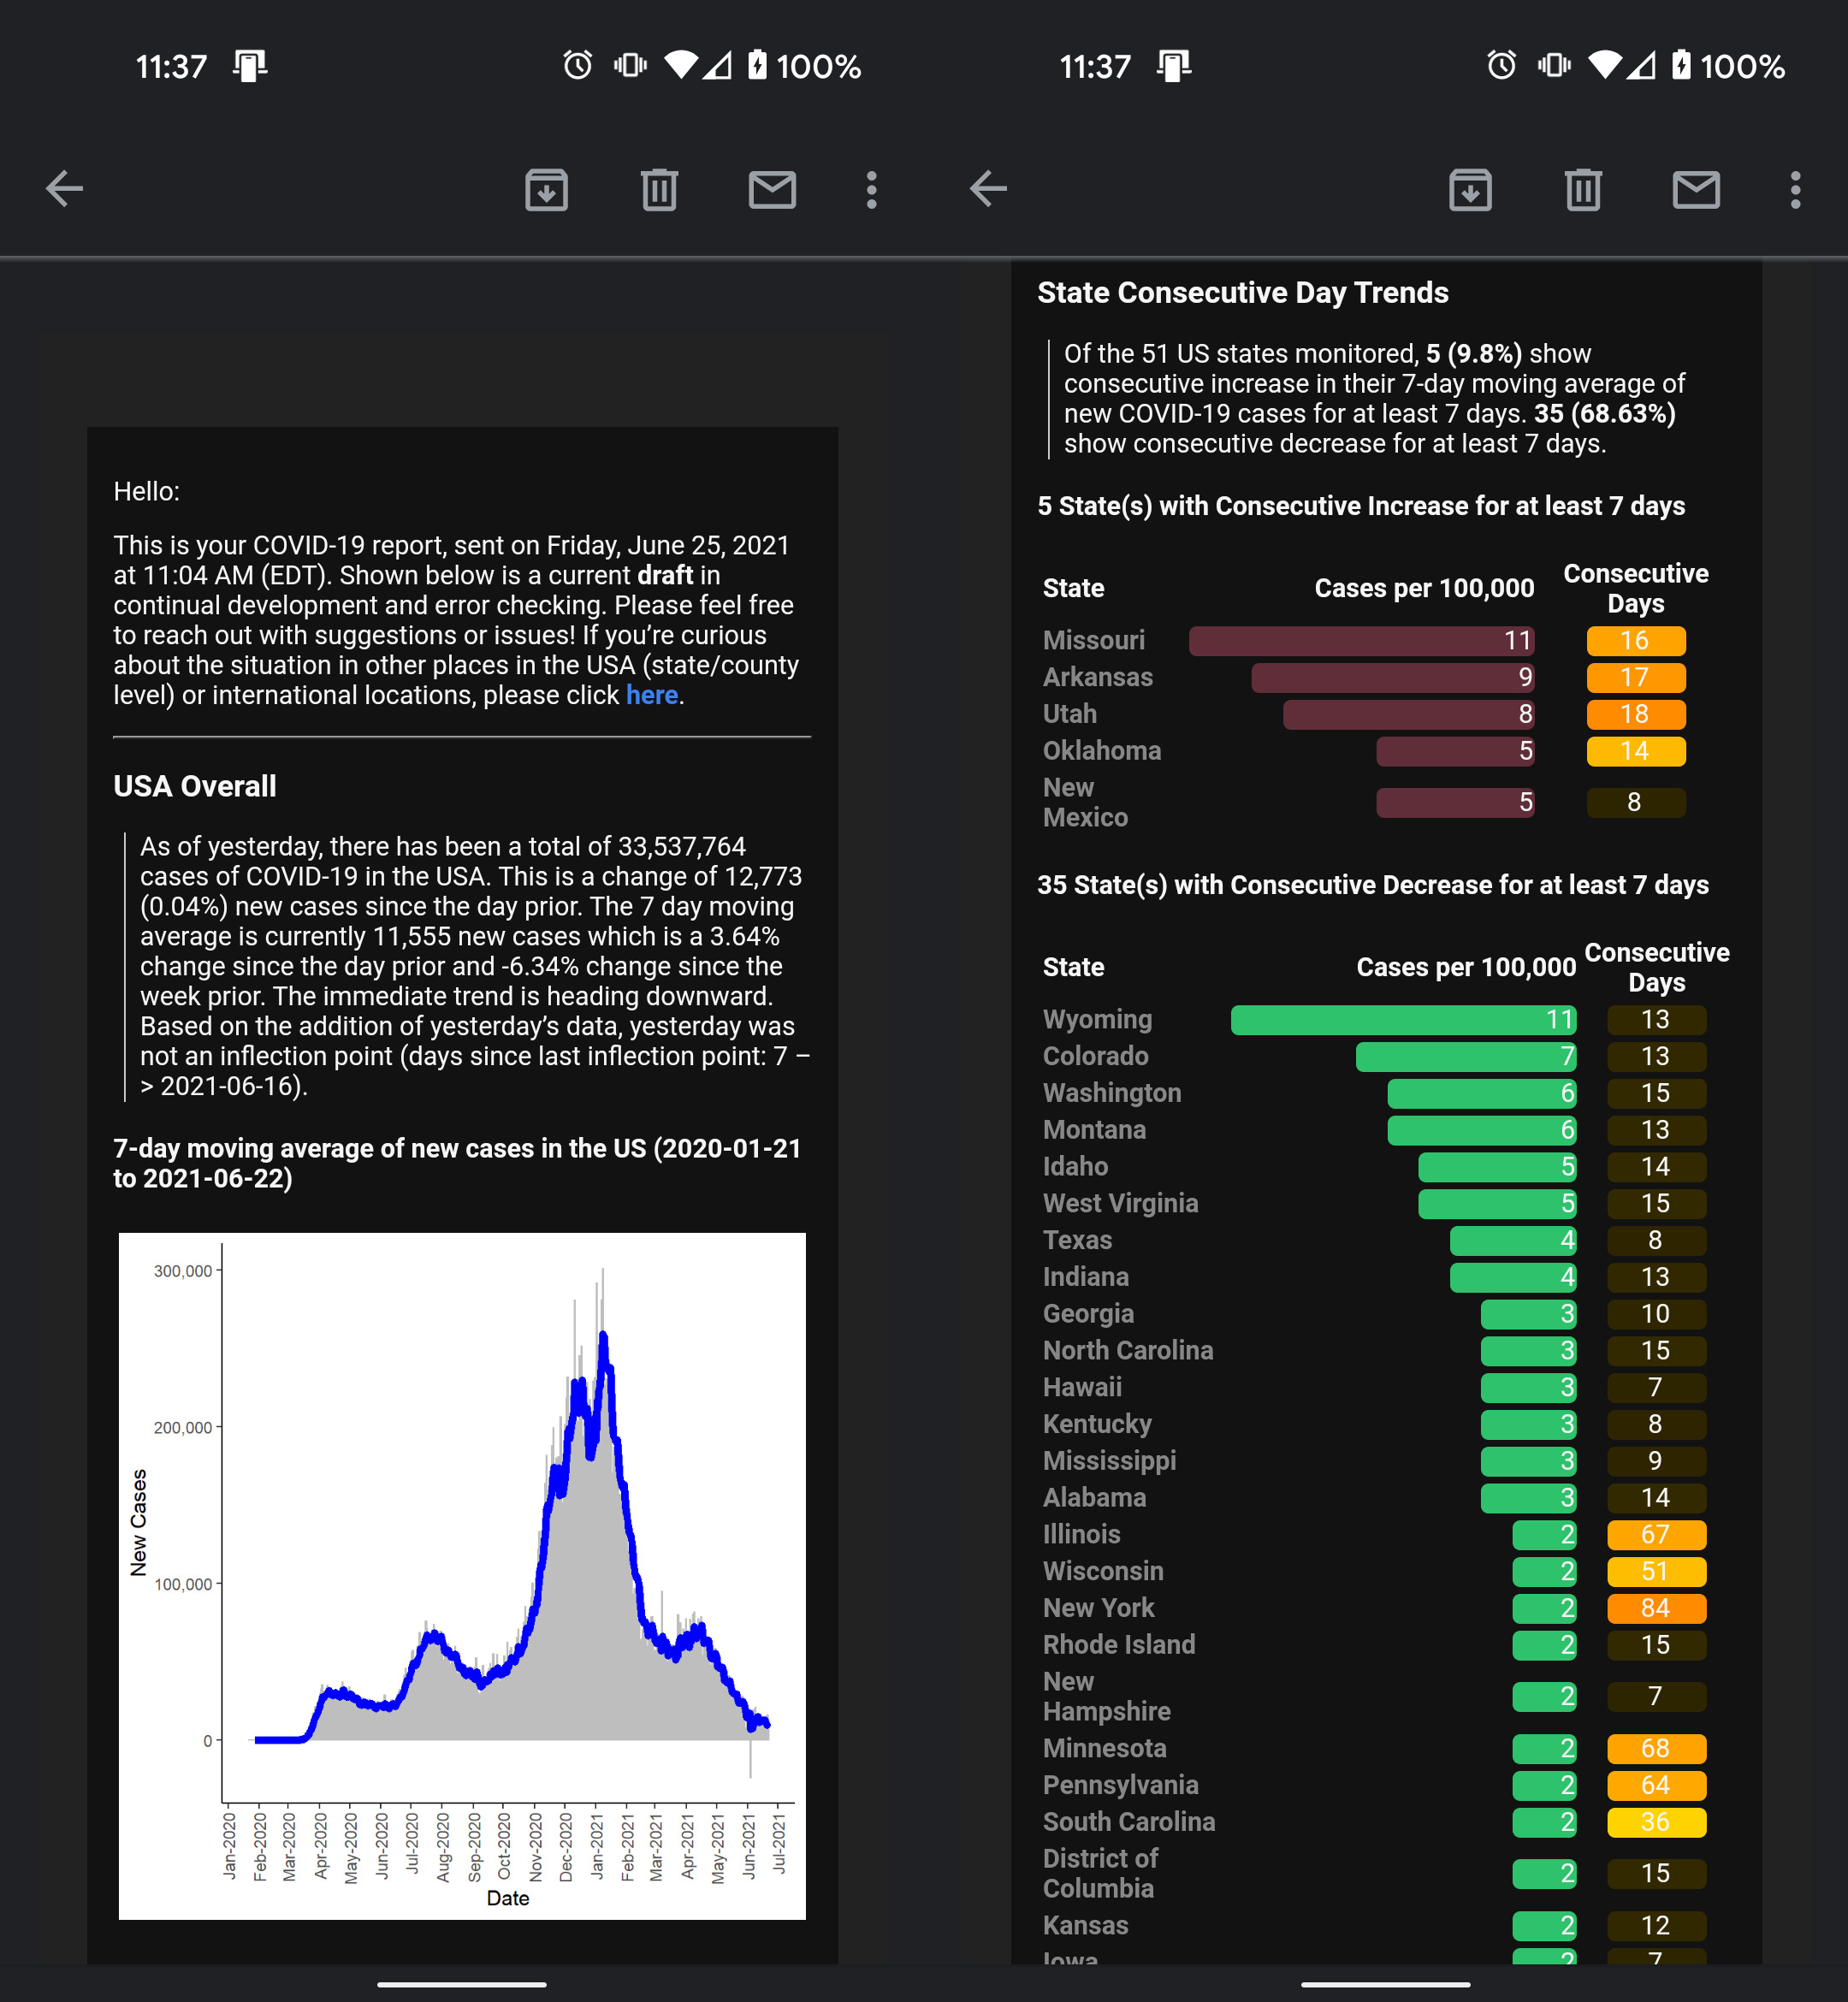
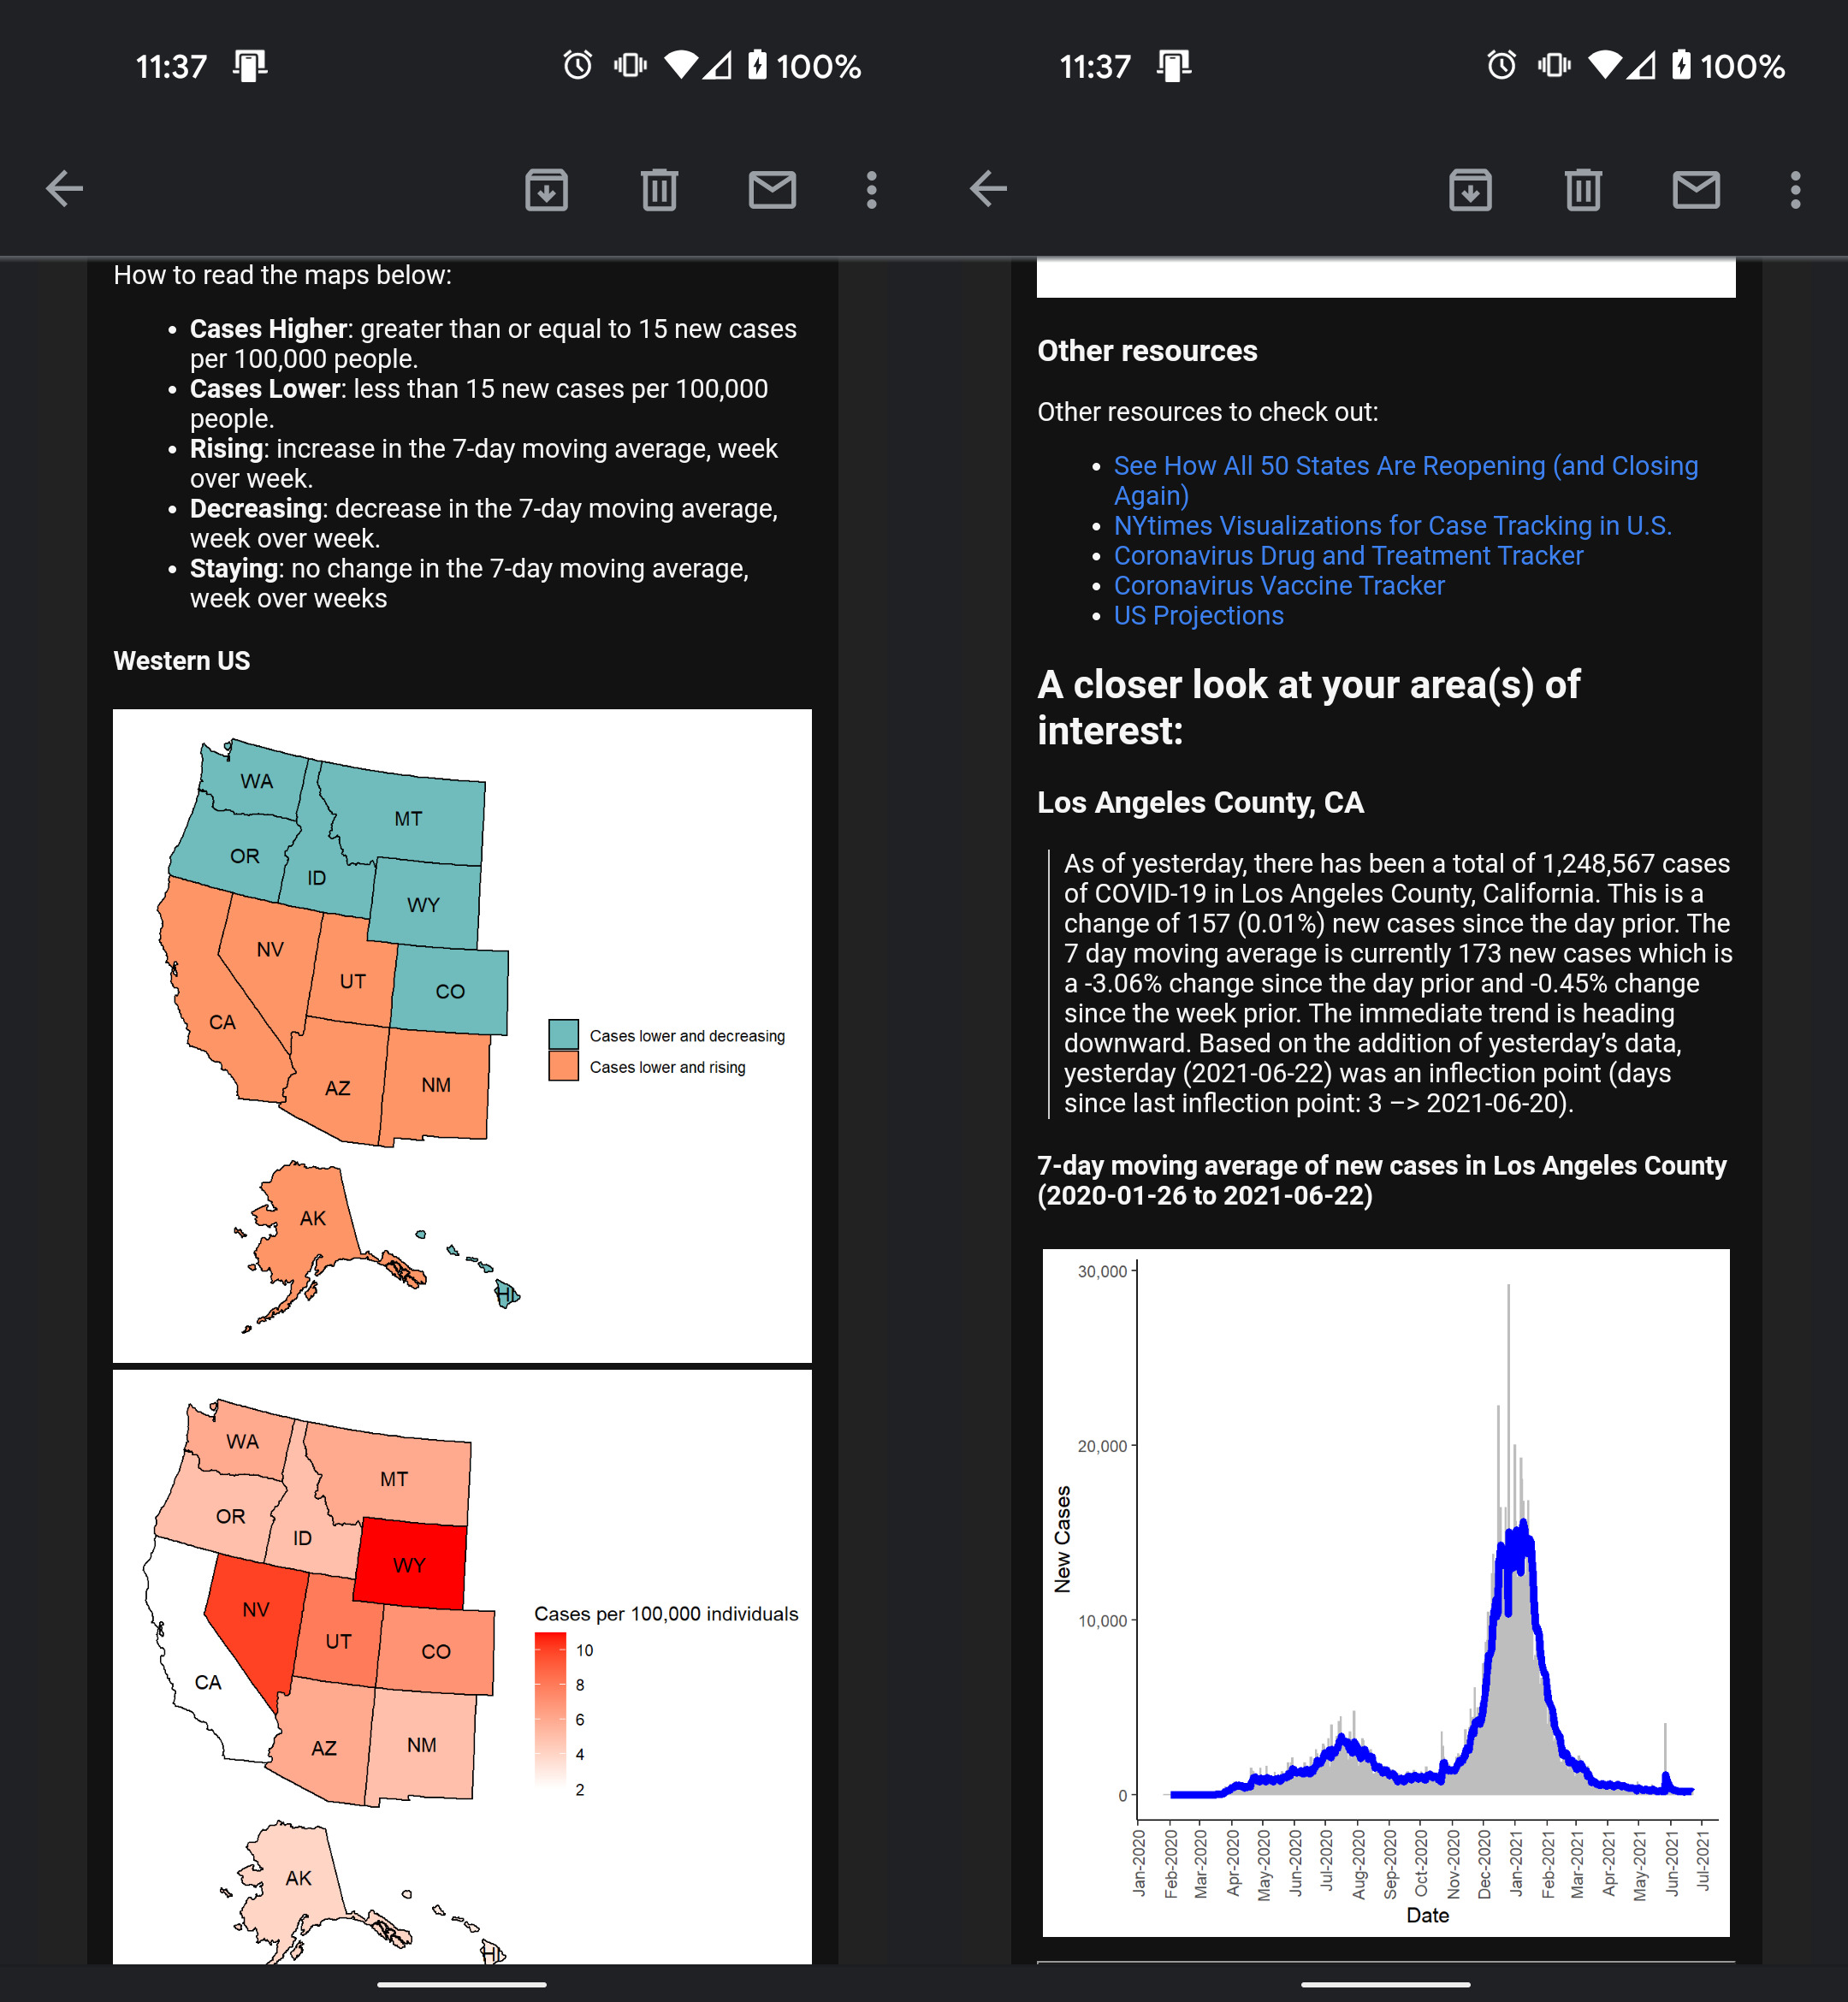
Introduction In New York City’s first COVID-19 wave (starting April 2020), I was overwhelmed parsing through new information, news, and data being released about COVID-19. In April, New York Times released their public ongoing repository for COVID-19 data for researchers and officials. Dashboards and visualizations were built and released, but I didn’t find them personable. Instead of a standing resource of high-level information to visit, I was looking for reliable data points on the outbreak to be delivered to me, daily. This is where automated email reporting came into play!
Methods There were three main R scripts to:
- Load and transform COVID-19 data from NYTimes and JHU.
- Compile tables and plots into report layout using RMarkdown
- Email compiled report to recipients using Blastula package
This email report was sent to ~20+ people interested in receiving daily updates on COVID-19. Recipients were able to provide ongoing feedback to improve the report’s interpretability and content. Edits were made to the main scripts in a staging folder separate from a production folder. I automated the report distribution using my computer’s windows task scheduler which triggered a .bat file and subsequently the “send_email.R” script. Sending an email from R required an email account/provider that allowed third-party access.
Lessons Learned Here are some of the major lessons learned from this project:
- Delays and issues in uploading information to data sources happen. Set flags within scripts to terminate code when necessary.
- In order to successfully automate a script, consider a cloud-based solution. My local desktop computer’s window task scheduler depends on AC power and wifi/internet connection (the latter for pulling data from github and sending emails). If either of those pieces were missing, the report did not go out.
- Blastula and mailR packages are great options for email distribution via R. I ended up going with Blastula because it was able to render an rmarkdown file which was easier to customize.
Data Sources: https://github.com/nytimes/covid-19-data https://github.com/CSSEGISandData/COVID-19
Tools: blastula, dplyr, ggplot2
Also, visit the project on GitHub.
Disclaimer: the opinions expressed and analyses performed are solely my own and do not necessarily reflect the official policy or position of my employer.